"If you’ve ever hunted when you’re hungry, you know you get a lot better at hunting," said Criss Wilson, data scientist with transportation management software provider McLeod. "When you’re starving for profit, you’re at a point when you can be very, very smart."
Wilson made the analogy as part of a presentation delivered at the Truckload Carriers Association's annual convention in early October in Las Vegas. His session stated the case to the mostly asset-based carrier representatives in attendance for another way to look at rates when negotiating with shipper clientele over annual or increasingly short-term freight contracts.
Chiefly, Wilson believed rates "averages," even when computed with granular detail on a lane-by-lane and segment-by-segment basis, could obscure valuable insights to be gained by viewing rates across the entire spectrum, more in line with the kind of market that truckload freight exists in. "Historical rate data is essential for us to do good quality rate analytics," he said, yet so much depends on data quality and the way rates are presented.
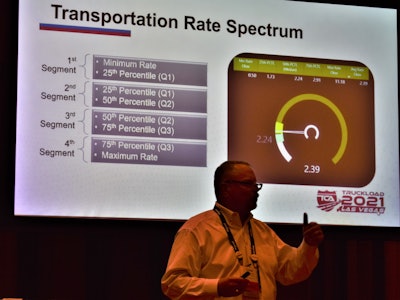
Wilson and McLeod are developing a tool to deliver insights from anonymized data from TMS customers among brokers and asset carriers that centers rate/lane analysis not solely in lane averages but rather by viewing the entire collection of rates examples/records across a spectrum, with four parts, or quartiles, made up of an equal number of rate observations.
In a set of data with 1,000 total rates arranged from lowest to highest, the 250th record is the boundary between Quartile 1 and Quartile 2. The 500th record sits at the 50th percentile, and represents the median of the entire set and the boundary between Q2 and Q3. And on up to the 1,000th record at the end boundary of Q4.
"If I showed you the rates in this form or fashion" along a line, "you might take something away from it but it’s not intuitive," Wilson said. Overlaying it with something that any trucker can understand, a tachometer, and pointing out where the quartile ranges fall as it relates to rates, he believed, can give rates decision-makers a way to quickly see pressures where they exist. See an example he gave below.
 In this example of rates during a particular time period on the lane from Dallas to Atlanta, the needle sits on the computed average rate on the spectrum of observations, which ranged from loads moved at 50 cents a mile on the low end to $11.18/mile at the top. That $2.39 average is parked just above the median rate in the set, also shown, at $2.24, which Wilson notes indicates generally upward market pressure on this lane.


